Examples
Here are a few examples to get you started with the dmd package.
More examples can be found in the examples directory of the source code.
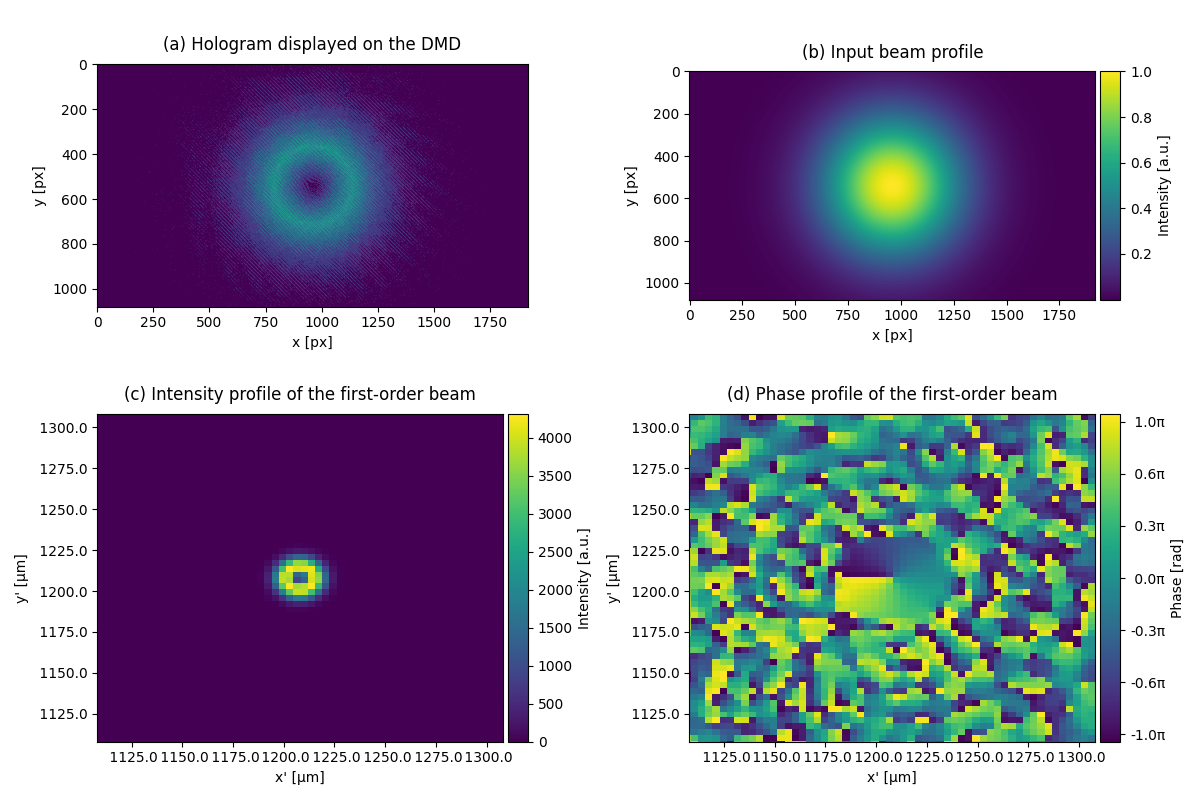
Create a donut beam (Laguerre-Gauss mode) with DMD
This example shows how to create a donut beam with a digital mircromirror device (DMD). The input beam profile has fundamental Gaussian mode. However, with the hologram displayed on the DMD, the beam profile at the image plane becomes a donut beam (Laguerre-Gaussian \(l=1\), \(p=0\), mode).
import pySLM2
from scipy.constants import micro, nano, milli
import numpy as np
import matplotlib.pyplot as plt
from mpl_toolkits.axes_grid1 import make_axes_locatable
from matplotlib.ticker import FuncFormatter


def to_um(x, pos):
    return f"{x/micro: .1f}"

def to_rad(x, pos):
    return f"{x/np.pi: .1f}π"


dmd = pySLM2.DLP9500(
    369 * nano,  # wavelength
    200 * milli, # effective focal length
    4, # periodicity of the grating = 4 pixels
    np.pi/4, # The dmd is rotated by 45 degrees
)

# The beam illumilating the DMD is an gaussian beam with a waist of 5 mm
input_profile = pySLM2.HermiteGaussian(0,0,1,5*milli)

# targeted profile at the image plane
output_profile = pySLM2.LaguerreGaussian(0,0,1,10*micro, l=1, p=0)

dmd.calculate_dmd_state(
    input_profile,
    output_profile,
    method="random"
)

fig = plt.figure(figsize=(12, 8))
gs = fig.add_gridspec(2, 2, width_ratios=[1,1], height_ratios=[1,1])

# Define subplots within the custom gridspec
axs = [fig.add_subplot(gs[0, 0]), fig.add_subplot(gs[0, 1]), fig.add_subplot(gs[1, 0]), fig.add_subplot(gs[1, 1])]

# Plot the images in the subplots
p0 = axs[0].imshow(dmd.dmd_state)
axs[0].set_xlabel("x [px]", fontsize=10, ha='center')
axs[0].set_ylabel("y [px]", fontsize=10, ha='center')

p1 = axs[1].imshow(dmd.profile_to_tensor(input_profile ** 2))
axs[1].set_xlabel("x [px]", fontsize=10, ha='center')
axs[1].set_ylabel("y [px]", fontsize=10, ha='center')

sim = pySLM2.DMDSimulation(dmd, padding_x=0, padding_y=(dmd.Nx - dmd.Ny) // 2)

# Perform the simulation
sim.propagate_to_image(input_profile)
sim.block_zeroth_order()

# Plot intensity profile
p2 = axs[2].pcolormesh(*sim.image_plane_padded_grid, sim.image_plane_intensity)
(x, y) = dmd.first_order_origin
axs[2].set_xlim(x-100*micro, x+100*micro)
axs[2].set_ylim(y-100*micro, y+100*micro)
axs[2].xaxis.set_major_formatter(FuncFormatter(to_um))
axs[2].yaxis.set_major_formatter(FuncFormatter(to_um))
axs[2].set_xlabel("x' [µm]", fontsize=10, ha='center')
axs[2].set_ylabel("y' [µm]", fontsize=10, ha='center')

# Plot phase profile
p3 = axs[3].pcolormesh(*sim.image_plane_padded_grid, np.angle(sim.image_plane_field))
(x, y) = dmd.first_order_origin
axs[3].set_xlim(x-100*micro, x+100*micro)
axs[3].set_ylim(y-100*micro, y+100*micro)
axs[3].xaxis.set_major_formatter(FuncFormatter(to_um))
axs[3].yaxis.set_major_formatter(FuncFormatter(to_um))
axs[3].set_xlabel("x' [µm]", fontsize=10, ha='center')
axs[3].set_ylabel("y' [µm]", fontsize=10, ha='center')

# Add subcaptions below the subplots
subcaptions = ["(a) Hologram displayed on the DMD",
               "(b) Input beam profile",
               "(c) Intensity profile of the first-order beam",
               "(d) Phase profile of the first-order beam"]

for i, ax in enumerate(axs):
    ax.set_title(subcaptions[i], fontsize=12,pad=10)

# Add colorbars
cbar_label = ['Intensity [a.u.]', 'Intensity [a.u.]', 'Phase [rad]']
for i, plot in enumerate([p1, p2, p3]):
    divider = make_axes_locatable(plot.axes)
    cax = divider.append_axes("right", size="5%", pad=0.05)
    cbar = plt.colorbar(plot, cax=cax, orientation='vertical')
    cbar.set_label(cbar_label[i])
    if 'Phase' in cbar_label[i]:
        cbar.formatter = FuncFormatter(to_rad)
        cbar.update_ticks()

# Adjust the spacing between subplots
plt.tight_layout()

# Show the plot
plt.show()
(Source code, png)

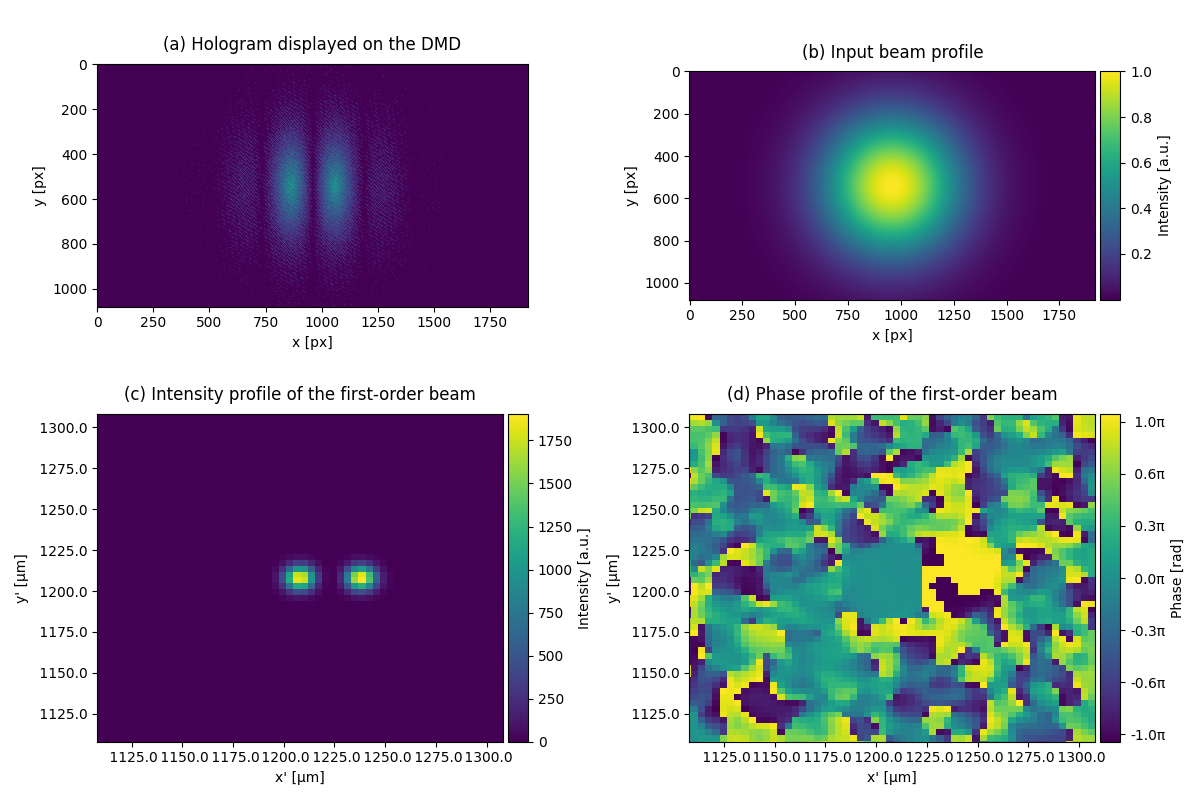
Create multiple beam spots with DMD
This example shows how to create multiple beam spots with a digital mircromirror device (DMD). The input beam profile has fundamental Gaussian mode. With the hologram displayed on the DMD, one can generate multiple beam spots at the image plane.
import pySLM2
from scipy.constants import micro, nano, milli
import numpy as np
import matplotlib.pyplot as plt
from mpl_toolkits.axes_grid1 import make_axes_locatable
from matplotlib.ticker import FuncFormatter


def to_um(x, pos):
    return f"{x/micro: .1f}"

def to_rad(x, pos):
    return f"{x/np.pi: .1f}π"

dmd = pySLM2.DLP9500(
    369 * nano,  # wavelength
    200 * milli, # effective focal length
    4, # periodicity of the grating = 4 pixels
    np.pi/4, # The dmd is rotated by 45 degrees
)

# The beam illumilating the DMD is an gaussian beam with a waist of 5 mm
input_profile = pySLM2.HermiteGaussian(0,0,1,5*milli)

# targeted profile at the image plane
# Here we create two gaussian spots separated by 30 microns
output_profile = pySLM2.HermiteGaussian(0,0,1,10*micro, n=0, m=0) - pySLM2.HermiteGaussian(30*micro,0,1,10*micro, n=0, m=0)

dmd.calculate_dmd_state(
    input_profile,
    output_profile,
    method="random"
)

fig = plt.figure(figsize=(12, 8))
gs = fig.add_gridspec(2, 2, width_ratios=[1,1], height_ratios=[1,1])

# Define subplots within the custom gridspec
axs = [fig.add_subplot(gs[0, 0]), fig.add_subplot(gs[0, 1]), fig.add_subplot(gs[1, 0]), fig.add_subplot(gs[1, 1])]

# Plot the images in the subplots
p0 = axs[0].imshow(dmd.dmd_state)
axs[0].set_xlabel("x [px]", fontsize=10, ha='center')
axs[0].set_ylabel("y [px]", fontsize=10, ha='center')

p1 = axs[1].imshow(dmd.profile_to_tensor(input_profile ** 2))
axs[1].set_xlabel("x [px]", fontsize=10, ha='center')
axs[1].set_ylabel("y [px]", fontsize=10, ha='center')

sim = pySLM2.DMDSimulation(dmd, padding_x=0, padding_y=(dmd.Nx - dmd.Ny) // 2)

# Perform the simulation
sim.propagate_to_image(input_profile)
sim.block_zeroth_order()

# Plot intensity profile
p2 = axs[2].pcolormesh(*sim.image_plane_padded_grid, sim.image_plane_intensity)
(x, y) = dmd.first_order_origin
axs[2].set_xlim(x-100*micro, x+100*micro)
axs[2].set_ylim(y-100*micro, y+100*micro)
axs[2].xaxis.set_major_formatter(FuncFormatter(to_um))
axs[2].yaxis.set_major_formatter(FuncFormatter(to_um))
axs[2].set_xlabel("x' [µm]", fontsize=10, ha='center')
axs[2].set_ylabel("y' [µm]", fontsize=10, ha='center')

# Plot phase profile
p3 = axs[3].pcolormesh(*sim.image_plane_padded_grid, np.angle(sim.image_plane_field))
(x, y) = dmd.first_order_origin
axs[3].set_xlim(x-100*micro, x+100*micro)
axs[3].set_ylim(y-100*micro, y+100*micro)
axs[3].xaxis.set_major_formatter(FuncFormatter(to_um))
axs[3].yaxis.set_major_formatter(FuncFormatter(to_um))
axs[3].set_xlabel("x' [µm]", fontsize=10, ha='center')
axs[3].set_ylabel("y' [µm]", fontsize=10, ha='center')

# Add subcaptions below the subplots
subcaptions = ["(a) Hologram displayed on the DMD",
               "(b) Input beam profile",
               "(c) Intensity profile of the first-order beam",
               "(d) Phase profile of the first-order beam"]

for i, ax in enumerate(axs):
    ax.set_title(subcaptions[i], fontsize=12,pad=10)

# Add colorbars
cbar_label = ['Intensity [a.u.]', 'Intensity [a.u.]', 'Phase [rad]']
for i, plot in enumerate([p1, p2, p3]):
    divider = make_axes_locatable(plot.axes)
    cax = divider.append_axes("right", size="5%", pad=0.05)
    cbar = plt.colorbar(plot, cax=cax, orientation='vertical')
    cbar.set_label(cbar_label[i])
    if 'Phase' in cbar_label[i]:
        cbar.formatter = FuncFormatter(to_rad)
        cbar.update_ticks()

# Adjust the spacing between subplots
plt.tight_layout()

# Show the plot
plt.show()
(Source code, png)

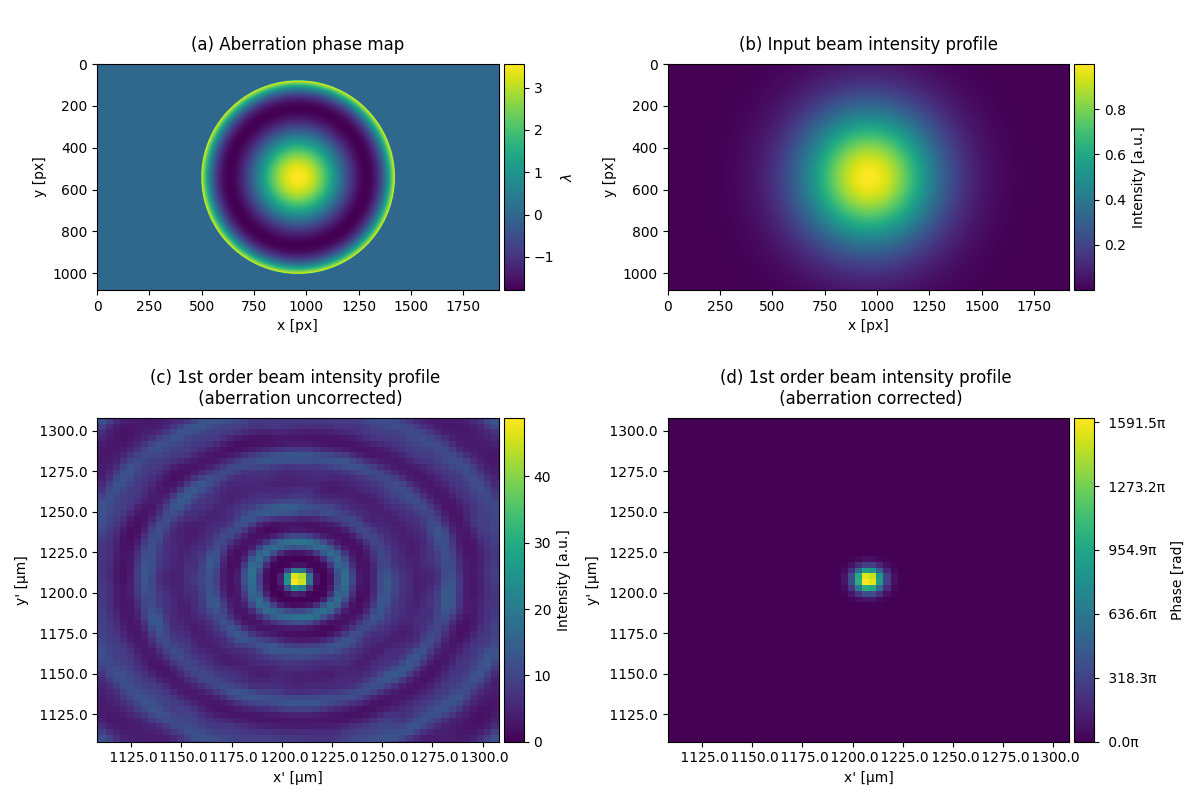
Perform abberation correction with DMD
This example shows how to create abberation correction to a Gaussian with spherical abberation.
import pySLM2
from scipy.constants import micro, nano, milli
import numpy as np
import matplotlib.pyplot as plt
from mpl_toolkits.axes_grid1 import make_axes_locatable
from matplotlib.ticker import FuncFormatter


def to_um(x, pos):
    return f"{x/micro: .1f}"

def to_rad(x, pos):
    return f"{x/np.pi: .1f}π"


dmd = pySLM2.DLP9500(
    369 * nano,  # wavelength
    200 * milli, # effective focal length
    4, # periodicity of the grating = 4 pixels
    np.pi/4, # The dmd is rotated by 45 degrees
)

# Aberration: Spherical aberration
aberration = pySLM2.Zernike(10, 5 * milli, n=4, m=0)

# The beam illumilating the DMD is an gaussian beam with a waist of 5 mm
input_profile_unaware_of_aberration = pySLM2.HermiteGaussian(0,0,1,5*milli)
input_profile = input_profile_unaware_of_aberration  * aberration.as_complex_profile()

# targeted profile at the image plane
output_profile = pySLM2.HermiteGaussian(0,0,1,10*micro, n=0, m=0)

#==============================================================================
fig = plt.figure(figsize=(12, 8))
gs = fig.add_gridspec(2, 2, width_ratios=[1,1], height_ratios=[1,1])

# Define subplots within the custom gridspec
axs = [fig.add_subplot(gs[0, 0]), fig.add_subplot(gs[0, 1]), fig.add_subplot(gs[1, 0]), fig.add_subplot(gs[1, 1])]

# Plot abberation phase map
p0 = axs[0].imshow(dmd.profile_to_tensor(aberration) / np.pi / 2)
axs[0].set_xlabel("x [px]", fontsize=10, ha='center')
axs[0].set_ylabel("y [px]", fontsize=10, ha='center')

p1 = axs[1].imshow(np.abs(dmd.profile_to_tensor(input_profile, complex=True))**2)
axs[1].set_xlabel("x [px]", fontsize=10, ha='center')
axs[1].set_ylabel("y [px]", fontsize=10, ha='center')

sim = pySLM2.DMDSimulation(dmd, padding_x=0, padding_y=(dmd.Nx-dmd.Ny)//2)

# Calculate the hologram without the knowledge of the aberration
dmd.calculate_dmd_state(
    input_profile_unaware_of_aberration,
    output_profile,
    method="random"
)

# perform the simulation
sim.propagate_to_image(input_profile)
sim.block_zeroth_order()

p2 = axs[2].pcolormesh(*sim.image_plane_padded_grid, sim.image_plane_intensity)
(x, y) = dmd.first_order_origin
axs[2].set_xlim(x-100*micro, x+100*micro)
axs[2].set_ylim(y-100*micro, y+100*micro)
axs[2].xaxis.set_major_formatter(FuncFormatter(to_um))
axs[2].yaxis.set_major_formatter(FuncFormatter(to_um))
axs[2].set_xlabel("x' [µm]", fontsize=10, ha='center')
axs[2].set_ylabel("y' [µm]", fontsize=10, ha='center')

# Calculate the hologram including the aberration
dmd.calculate_dmd_state(
    input_profile,
    output_profile,
    method="random"
)

# perform the simulation
sim.propagate_to_image(input_profile)
sim.block_zeroth_order()


p3 = axs[3].pcolormesh(*sim.image_plane_padded_grid, sim.image_plane_intensity)
(x, y) = dmd.first_order_origin
axs[3].set_xlim(x-100*micro, x+100*micro)
axs[3].set_ylim(y-100*micro, y+100*micro)
axs[3].xaxis.set_major_formatter(FuncFormatter(to_um))
axs[3].yaxis.set_major_formatter(FuncFormatter(to_um))
axs[3].set_xlabel("x' [µm]", fontsize=10, ha='center')
axs[3].set_ylabel("y' [µm]", fontsize=10, ha='center')

# Add subcaptions below the subplots
subcaptions = ["(a) Aberration phase map",
               "(b) Input beam intensity profile",
               "(c) 1st order beam intensity profile \n (aberration uncorrected)",
               "(d) 1st order beam intensity profile \n (aberration corrected)"]

for i, ax in enumerate(axs):
    ax.set_title(subcaptions[i], fontsize=12,pad=10)

# Add colorbars
cbar_label = ['$\lambda$', 'Intensity [a.u.]', 'Intensity [a.u.]', 'Phase [rad]']
for i, plot in enumerate([p0, p1, p2, p3]):
    divider = make_axes_locatable(plot.axes)
    cax = divider.append_axes("right", size="5%", pad=0.05)
    cbar = plt.colorbar(plot, cax=cax, orientation='vertical')
    cbar.set_label(cbar_label[i])
    if 'Phase' in cbar_label[i]:
        cbar.formatter = FuncFormatter(to_rad)
        cbar.update_ticks()

plt.tight_layout()
plt.show()
(Source code, png)

Load image to the Luxbeam DMD controller
from pySLM2.util import LuxbeamController

luxbeam = LuxbeamController(ip="192.168.1.10")
luxbeam.initialize()

# generate two images
image_1 = luxbeam.number_image(1)
image_2 = luxbeam.number_image(2)

luxbeam.load_multiple([image_1, image_2])

print("Use trigger (software or external) to switch between images")
while True:
    input("Press Enter to fire software trigger...")
    luxbeam.fire_software_trigger()